Multi-Agent Commodity Analyst
LLM Agents · MSGARCH / GARCH / ARIMA · Python orchestrates, R models · 167 tests
The business question
What is corn and soybean price volatility telling us — and can a language model write that analysis without inventing a single number?
The second half is the harder one. A model that hallucinates a plausible figure in a commodity report is worse than no report at all, because the figure looks right.
The data
Daily settlement prices from CBOT via Yahoo Finance: corn (ZC=F), 2,007 observations, and soybeans (ZS=F), 2,009 observations, both from 2 January 2018 to 30 December 2025. The USD/BRL rate (BRL=X) comes along, because analysing Brazilian domestic grain prices without the exchange rate is simply wrong.
Everything is frozen in a parquet cache with a metadata sidecar recording where each series came from. Two consequences: the published chart does not change on its own when the market moves, and the end-to-end test runs with no network.
The domestic CEPEA series is not implemented in this version. Rather than hide that, the collector falls back to the international series and the report prints the source swap above the chart. A system that states what it could not get is worth more than one that quietly substitutes.
Method, and why this one
The agents do not know econometrics. Four of them — Collector, Econometrician, Critic, Writer — decide which function of the core to call and with which arguments. The core is plain, deterministic, testable Python and R. When the agent framework ages, the shell gets replaced and the part that matters stays.
Python orchestrates, R models. The model ladder is MSGARCH → GARCH → ARIMA, called over subprocess with a JSON contract. No rpy2, deliberately: it is the number-one source of installation pain in R+Python projects, and the goal was that anyone can clone and run. As a bonus, the R script runs standalone in RStudio when a model needs debugging.
The Critic rejects, with a written reason. It runs Ljung-Box and ARCH-LM on the residuals. Failure is not a silent retry — it is a rejection with a stated cause, capped at three attempts, backing down the model family each time.
The guard. The Writer cannot put a number in the text that does not exist in the results object. An invented number fails the run. The guard’s limits are documented in the repository too — it verifies digit provenance, not semantic meaning — because a case study that oversells its own safety net defeats the purpose.
Result
The interesting outcome is not the forecast. It is that the critique loop fired in production, not in a test: in both commodities the Critic rejected MSGARCH — the signature model of my doctoral work — and approved GARCH on the second attempt.
For corn, ARCH-LM returned p = 0.0405; for soybeans, p = 0.0242. Both below 0.05, both meaning heteroskedasticity the model had not captured. The report says so, names the family, and gives the reason.
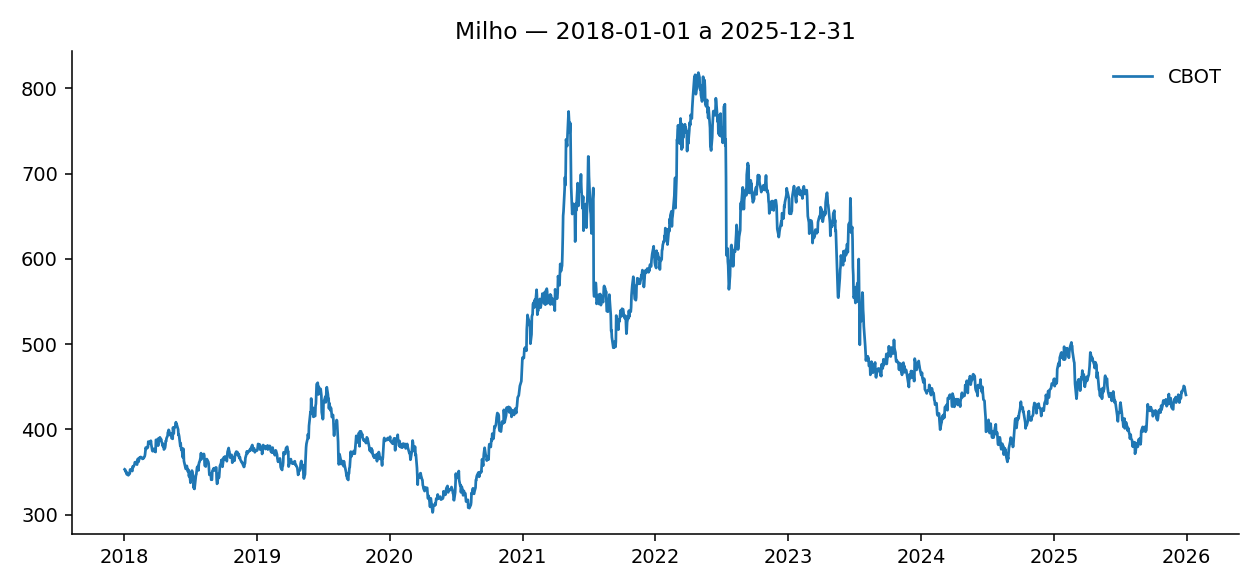
ZC=F), 2018–2025. The system produced this chart and the report beside it, from the frozen cache, with no network and no API key.On the backtest, honesty matters more than a good-looking number: over a 20-step horizon the model scored MAPE 1.75% for corn — identical to the random walk. That is not a failure, it is arithmetic. Volatility models fix the mean at zero by construction, so the point forecast ties with a random walk by definition. Their contribution lives in the interval width and the residual diagnostics, and the system’s own report explains this without being asked.
Code
github.com/rhozon/commodity-agents
Clone it, pip install -r requirements.txt, install R 4.x with the packages listed in the README, then:
python run.py --commodity milho --fake-llmIt runs from the frozen cache — no API key, no network. The test suite is 167 tests via pytest -q. The examples/ folder holds the reports for both commodities, generated by the system itself.